We’re (again) a major telecom operator. Just like pretty much any company in the world, we are concerned with keeping our customers happy, so they won’t leave us. In other words, we want to reduce churn. To do this, we set up a task force of data analysts and people from our business teams who came up with several business goals to reduce churn.
So in a way described in the “Predicting churn project”, we created a model to predict churn. In conjunction with the marketing team, we decided on a few actions to take for likely churners. In order to measure the usefulness of these actions, we set up an A/B test. A random sample of around half of the customers were targeted. the result of this A/B test is what we analyze in this project.
Before starting, we recommend you have a look at the following link to be familiar with uplift modeling theory.
Business Goal
- Target clients with more effective advertising based on their usage profiles
- Retrieve customers with very high likeliness of churn so we could get in touch and offer them special deals before they even thought of leaving
How Did We Do This ?
- The simplest approach consist in targeting likely churners. But likely churners may not be the people the more likely to react positively to our treatment. In our case we suppose there are 4 main types of people :
- lost cause : highly likely to churn and unlikely to react positively to any marketing action. We should not bother targeting these people.
- persuadable : highly likely to churn but likely to react positively to any marketing action. This is our real target !
- sure thing : unlikely to churn whatever happens. Targeting them is a waste of money.
- sleeping dog : unlikely to churn unless targeted by a marketing action. These are the people that had forgotten they are paying a subscription or hate to be targeted by marketing actions. This segmentation is not known before the A/B test. It is indeed a hidden variable that impacts our outcome : churn or not.
- Contrary to churn modeling, uplift is about predicting the gain of probability when the user is targeted by a marketing action. This enable us to target the customers most likely to respond well to our actions.
Thus, if we denote X the covariates, T the treatment set (targeted by marketing) and C the control set, uplift is about estimating :
U = P(churn=0| X, T) - P(churn=0| X, C)
- There are three common ways to do so :
- model separately the two probabilities and do the difference
- use a change of target variable
- use specific machine learning models (out of the scope of this project)
Explore This Sample Project
Flow
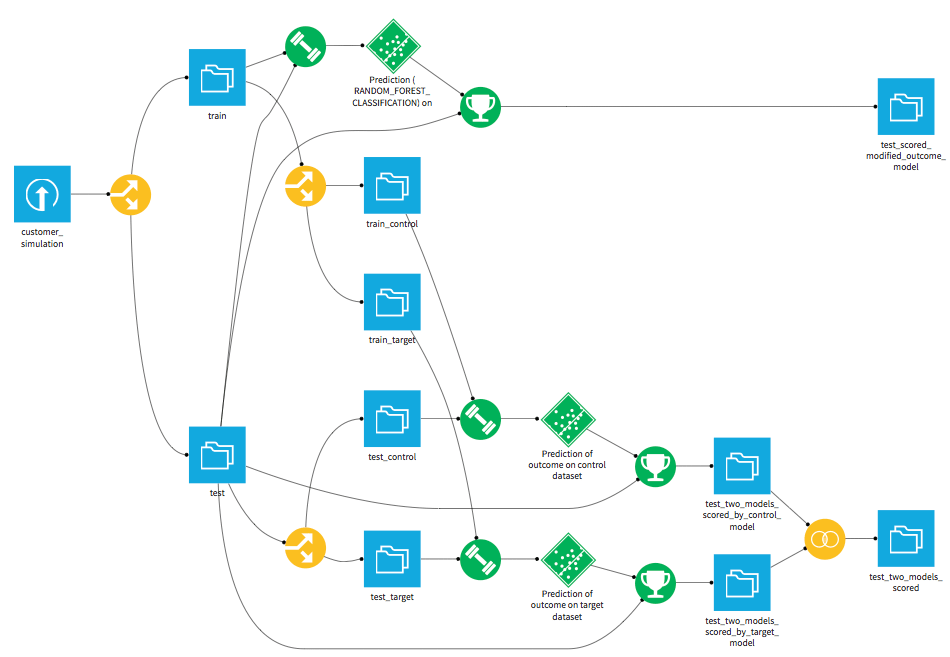
Start by taking a look at the flow to see the different steps of data preparation and machine learning that are needed for this project. Notice that there are two approaches. One is to create two models, one for the control dataset and one for the target (treatment) dataset. We then predict the outcome of these two models resulting in the dataset test_two_models_scored. The second approach is to model a transformed outcome variable. We'll compare this modelling technique to the first one by looking at the outcome in test_scored_modified_outcome_model.
EXPLORE !
Dashboard
Take a look at the distribution of the customer churn and customer types with the interactive charts available in the dashboard.
EXPLORE!
Control Model
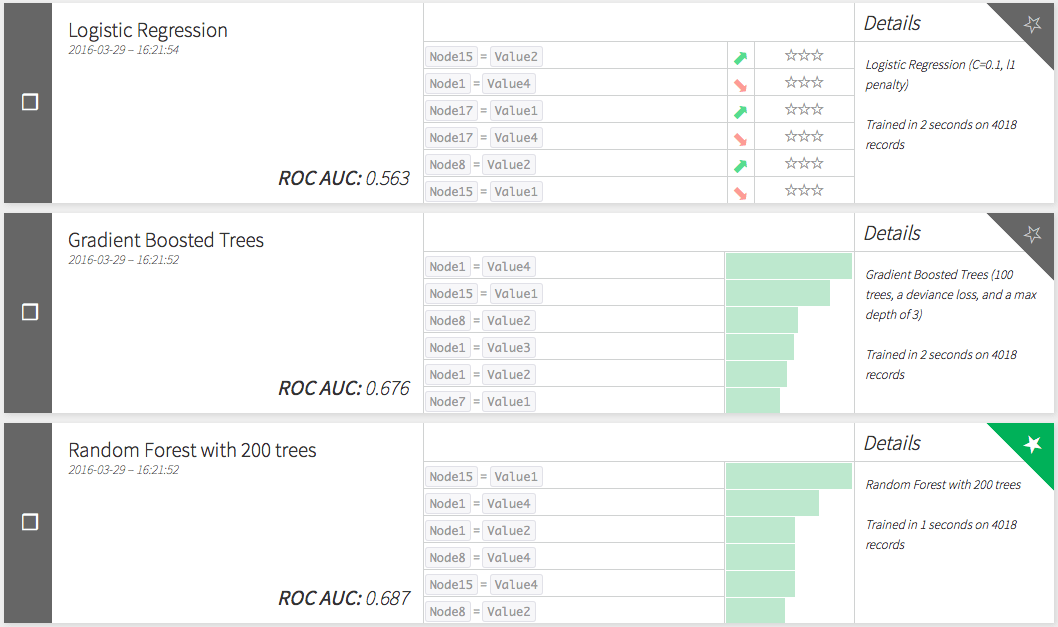
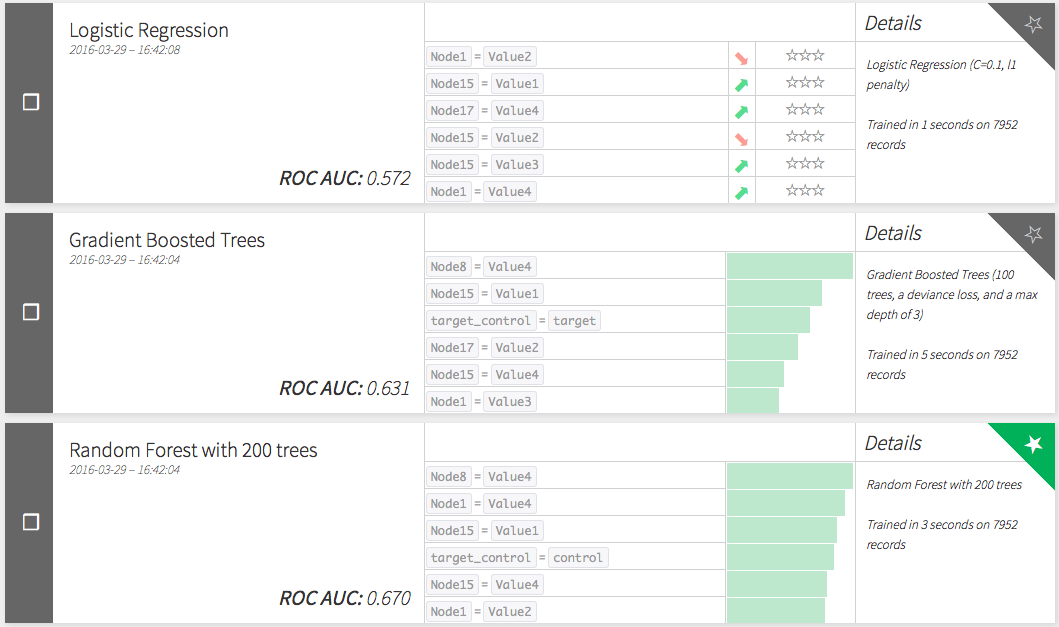
Let's have a look at the performances of the control models to predict churn.
EXPLORE!
Target Modelling
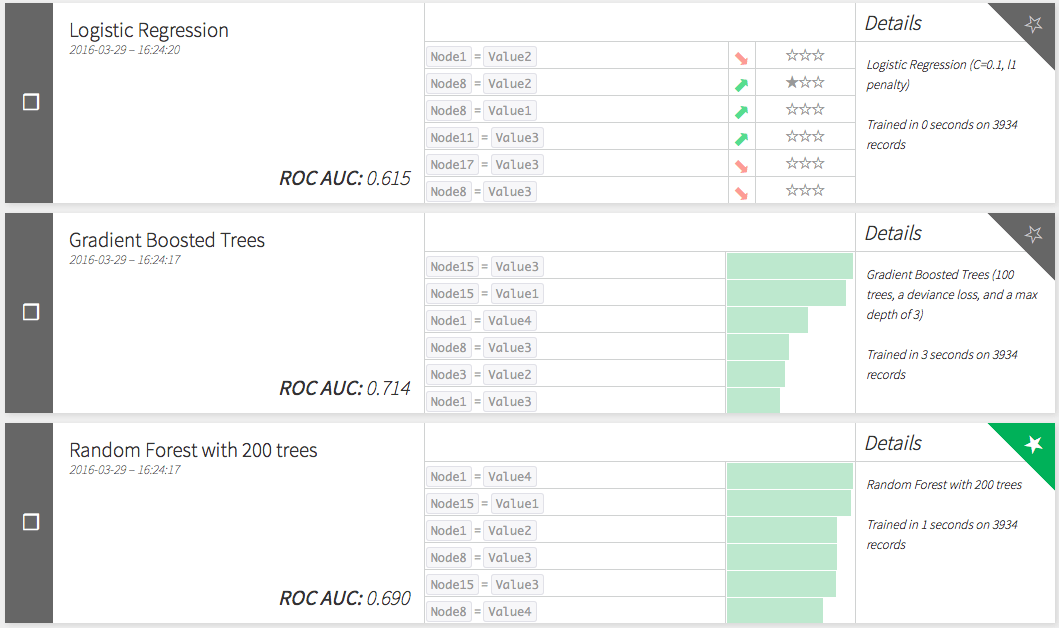
Let's have a look at the performances of the target models to predict churn.
EXPLORE!
Second Model Approach
Next, have a look at the second modelling approach. We first modified the outcome variable (Script part of the analysis) and then modelled it in the Machine learning part of the studio.
EXPLORE!
Models Evaluation
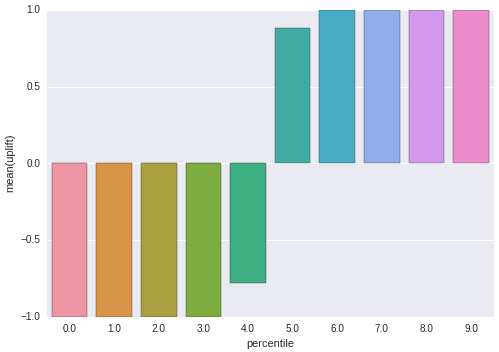
Finally, check out the uplift models performances and comparaison by going back to the dashboard to the shared jupyter notebook (at the bottom of the dashboard)
EXPLORE!
